
College Football Preseason Rankings and Predictions 2024
Georgia and Ohio State are two of the favorites to reach the playoffs in our 2024 college football preseason predictions.
August 19, 2024 – by Jason Lisk
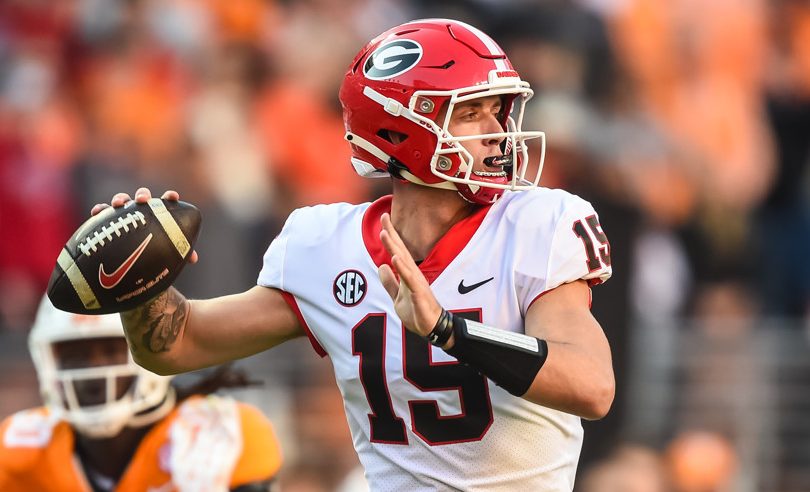
Georgia Bulldogs quarterback Carson Beck will try to return them to the CFB title game (Bryan Lynn/Icon Sportswire)
Michigan finally broke the SEC’s four-year stranglehold on the college football title last year, but then head coach Jim Harbaugh left for the NFL. Georgia, who missed out on the CFB Playoff after the SEC title game loss to Alabama, returns to the top of our 2024 College Football preseason predictions.
The 2024 season will be a year of massive shifts in college football. That includes many notable conference realignments and the de facto end of the Pac-12 Conference, with ten members scattering to other leagues. There is also an expanded playoff format, going from four teams to 12 this year.
In this massive college football preview post, we’ve compiled all of our preseason rankings and predictions for the 2024 college football season in one place. We’ll review our rankings, the conference outlooks, playoff projections, and bowl game predictions.
Preseason Predictions Menu
You can use the links below to jump to any section you want to read:
College Football Rankings HighlightsConference Champion OddsCollege Football Playoff OddsCFB Playoff Matchup PredictionsFBS Conference BreakdownsFull Preseason Rankings (All Teams)How We Make Preseason Predictions

NFL Week 1 Picks
Betting – Survivor – Pick’em
Start Free TrialGet The Season
2024 TR College Football Preseason Top 25
Jump to Rankings for All 134 FBS Teams
The table below features our 25 highest-ranked preseason teams (e.g., Georgia at No. 1) and their associated preseason predictive ratings (e.g., 32.6 for Georgia).
The final five columns show the relative contribution of specific predictive factors and our “market adjustment” to our final preseason rating for each team. We’ll explain those factors below.
| RANK | TEAM | RATING | LAST YEAR | PROGRAM | RETURN | LUCK | MARKET |
|---|---|---|---|---|---|---|---|
| 1 | Georgia | 32.6 | 20.4 | 6.1 | 0.6 | 0.7 | 4.8 |
| 2 | Ohio State | 27.7 | 17.7 | 6.0 | -0.8 | -0.6 | 5.4 |
| 3 | Texas | 24.3 | 16.8 | 3.5 | -2.8 | -1.3 | 8.1 |
| 4 | Oregon | 23.8 | 20.3 | 2.1 | -2.1 | -1.6 | 5.1 |
| 5 | Alabama | 23.6 | 16.6 | 7.3 | -1.9 | -0.7 | 2.2 |
| 6 | Penn State | 23.0 | 17.7 | 2.7 | 4.2 | -0.1 | -1.4 |
| 7 | Mississippi | 20.7 | 12.3 | 2.5 | 0.9 | -1.0 | 6.0 |
| 8 | Notre Dame | 20.3 | 17.5 | 4.1 | -0.3 | -2.1 | 1.0 |
| 9 | Louisiana State | 19.8 | 15.7 | 1.8 | -4.0 | 0.6 | 5.7 |
| 10 | Michigan | 19.4 | 21.5 | 2.9 | -1.9 | -1.6 | -1.4 |
| 11 | Tennessee | 18.0 | 11.1 | 2.0 | -1.4 | 0.5 | 5.7 |
| 12 | Florida State | 17.7 | 13.2 | 0.0 | -3.8 | -0.6 | 9.0 |
| 13 | Utah | 17.5 | 5.8 | 2.5 | 1.0 | -0.3 | 8.5 |
| 14 | Oklahoma | 17.5 | 15.9 | 4.4 | -0.8 | -1.4 | -0.6 |
| 15 | Clemson | 17.4 | 8.6 | 4.7 | 5.1 | -0.8 | -0.2 |
| 16 | Texas A&M | 17.4 | 10.3 | 3.4 | -1.0 | 0.2 | 4.5 |
| 17 | Missouri | 17.0 | 13.3 | 0.4 | 5.0 | -2.1 | 0.5 |
| 18 | Kansas State | 16.2 | 14.5 | 1.5 | 0.0 | -1.0 | 1.2 |
| 19 | Oklahoma State | 13.8 | 4.1 | 3.3 | 6.6 | 0.2 | -0.3 |
| 20 | Miami | 13.3 | 6.9 | 2.0 | -2.8 | 1.4 | 5.8 |
| 21 | Iowa State | 12.4 | 5.7 | 3.6 | 8.5 | -1.8 | -3.6 |
| 22 | Southern California | 12.4 | 8.7 | 1.7 | -6.7 | 0.8 | 7.8 |
| 23 | Iowa | 12.4 | 2.8 | 3.4 | 5.8 | 0.0 | 0.3 |
| 24 | Kansas | 11.3 | 7.4 | -3.1 | 2.9 | 1.4 | 2.7 |
| 25 | Florida | 11.2 | 4.9 | 2.9 | 4.5 | 0.9 | -2.0 |
Preseason Ratings Predictive Factors
Over the years, we’ve conducted extensive research to identify and value team-level stats highly correlated with college football success.
We’ve also researched to identify information that seems like it should help determine a team’s future performance but doesn’t hold up to rigorous historical testing.
Here’s a quick explanation of the factors we currently use in our preseason ratings:
LAST YEAR: How good a team was last yearPROGRAM: How good a team has been in recent history (excluding last year)RETURN: Measure of returning player performance in several key stat areas relative to teams of this general qualityLUCK: How likely a team is to improve in higher-variance metrics (e.g., turnovers)MARKET: Adjustment if our initial projection is far off the betting market or the Associated Press poll
You can also find more in our preseason rankings explanation post.
Return to Main Menu
College Football Preseason Rankings Highlights
The New SEC and Big Ten Dominate. The Top seven teams and 10 of the Top 11 come from either the Big Ten or SEC. That includes newcomers Texas (from the Big 12 to SEC) and Oregon (from the Pac-12 to Big Ten). Notre Dame is the highest-ranked team outside those two conferences, at No. 8.Look at ratings, not rankings. People tend to fixate on rankings, but the ratings are more important. In our ratings, Missouri is one example, ranked No. 17 but closer to No. 9 LSU than No. 19 Oklahoma State. There’s also only a 1.0 point difference between No. 11 Tennessee and No. 17 Missouri, so the teams in that range can be viewed as part of a tier, as there’s nearly another full point to No. 18 Kansas State and over three points difference to No. 19 Oklahoma State.No teams outside the Power Four are in the Top 25. Expansion has consolidated the football powers, and there are no other schools outside the ACC, Big Ten, Big 12, SEC, or Notre Dame in our Top 25. You have to go down to No. 40 Memphis to get the highest-ranked team outside that group.
Return to Main Menu
Conference Champion Odds
Here are the most likely teams to win each FBS conference according to our preseason predictions, along with each team’s conference-champion odds:
| CONFERENCE | FAVORITE | ODDS TO WIN |
|---|---|---|
| ACC | Florida St | 23% |
| Big 12 | Utah | 24% |
| Big Ten | Ohio St | 33% |
| SEC | Georgia | 36% |
| AAC | Memphis | 24% |
| C-USA | Liberty | 61% |
| MAC | Miami (OH) | 27% |
| MWC | Boise St | 38% |
| Sun Belt | Appalachian St | 27% |
Liberty, in Conference USA, is the biggest conference favorite and the only one projected with over 50% odds to win the championship. Georgia (36%) has the most significant odds among the power conference schools. The ACC, Big 12, and American Athletic Conferences are projected as the most wide-open conferences, with no team projected with greater than a 25% chance of winning the conference.
In-Season Updates
Once the 2024 college football season starts, our college football predictions page will update daily with our season projections and conference title odds.
Return to Main Menu
College Football Playoff Odds
The College Football Playoff is expanding to 12 teams in 2024, and the playoffs will run from December 20th to the Championship Game on January 20th.
Here are the rules for the new playoffs:
The five highest-ranked conference champions will advance to the playoff format, with the four highest-ranked being seeded 1 to 4 and getting byes into the quarterfinals that will be played on December 31st or January 1st at the traditional New Year’s Six bowl rotation sites that are not hosting the semifinals.The other seven teams are at-larges that go to the highest-ranked teams in the Selection Committee rankings, and there is no limit on the number of teams from any conference.Those seven at-larges plus the lowest-ranked qualifying conference champion will be seeded Nos. 5 through No. 12, and the games will be played at campus sites on December 20th and 21st.The bracket will not be re-seeded after the first round or the quarterfinals.The 2024 semifinals will be held on January 9th (Orange Bowl) and January 10th (Cotton Bowl).
We had to adjust our odds estimate for the playoffs with the expansion. These estimates are a blend of different factors:
The predicted power ratings for each team compared to how past playoff teams rankedFor Power Conference schools, the odds of qualifying as conference winner plus a record-based projection for non-conference-winners, based on odds of hitting certain win totals;For Group of Five schools, the conference win odds and a comparative hierarchy based on finishing at certain win totals (For example, American over other conferences if tied on record);Betting market playoff odds
| School | Conference | Undefeated | Playoff Odds |
|---|---|---|---|
| Georgia | SEC | 19% | 82% |
| Ohio State | Big Ten | 17% | 79% |
| Oregon | Big Ten | 11% | 66% |
| Texas | SEC | 7% | 62% |
| Penn State | Big Ten | 11% | 60% |
| Notre Dame | Independent I-A | 0% | 58% |
| Alabama | SEC | 5% | 51% |
| Mississippi | SEC | 4% | 49% |
| Louisiana State | SEC | 3% | 43% |
| Michigan | Big Ten | 3% | 42% |
| Missouri | SEC | 3% | 36% |
| Florida State | ACC | 6% | 34% |
| Tennessee | SEC | 2% | 34% |
| Utah | Big 12 | 9% | 34% |
| Clemson | ACC | 4% | 31% |
| Texas A&M | SEC | 2% | 30% |
| Kansas State | Big 12 | 6% | 27% |
| Miami | ACC | 4% | 24% |
| Oklahoma | SEC | 1% | 23% |
| Liberty | CUSA | 20% | 19% |
| Boise State | Mountain West | 3% | 18% |
| Iowa | Big Ten | 1% | 17% |
| Oklahoma State | Big 12 | 4% | 17% |
| Southern California | Big Ten | 1% | 15% |
| Memphis | AAC | 4% | 14% |
| NC State | ACC | 2% | 14% |
| Louisville | ACC | 1% | 13% |
| Kansas | Big 12 | 2% | 13% |
| Iowa State | Big 12 | 2% | 12% |
| Auburn | SEC | 0% | 11% |
| Nebraska | Big Ten | 1% | 11% |
| Southern Methodist | ACC | 3% | 11% |
| Central Florida | Big 12 | 2% | 11% |
| Virginia Tech | ACC | 3% | 10% |
| Wisconsin | Big Ten | 0% | 9% |
| Arizona | Big 12 | 1% | 9% |
| West Virginia | Big 12 | 1% | 8% |
| Rutgers | Big Ten | 0% | 8% |
| Kentucky | SEC | 0% | 8% |
| Texas Tech | Big 12 | 1% | 7% |
| Tulane | AAC | 2% | 7% |
| Texas Christian | Big 12 | 1% | 7% |
With the new format allowing more wild cards, seven different teams are projected to have at least a 50% chance of reaching the playoffs.
The overall breakdown of projected teams by conference is:
SEC – 4.3 teamsBIG 10 – 3.2 teamsACC – 1.5 teamsBIG 12 – 1.4 teamsIndependents – 0.6 teamsOther Conferences: 1.0 teams
For the other conferences, we project Liberty (19%), Boise State (18%), Memphis (14%), and Tulane (7%) as the most likely participants. Memphis is our highest-rated of that group but has lower odds of winning its conference. Liberty, meanwhile, probably needs to go undefeated because the schedule is not very difficult. Still, we give them a 20% chance to do so, meaning they are highly likely (but not a lock) to get the final conference champion bid if they do so.
Return to Main Menu
College Football Playoff Matchup Predictions 2024
These are our predictions for how the CFB Playoff bracket will shake out based on our playoff odds projections and the rules for seeding:
First Round, December 20-21
No. 5 Oregon vs. No. 12 LibertyNo. 6 Texas vs. No. 11 LSUNo. 7 Penn State vs. No. 10 MississippiNo. 8 Notre Dame vs. No. 9 Alabama
Quarterfinals, December 31-January 1
Sugar: No. 1 Georgia vs. No. 8 Notre Dame/No. 9 AlabamaRose: No. 2 Ohio State vs. No. 7 Penn State/No. 10 MississippiPeach: No. 3 Florida State vs. No. 6 Texas/No. 11 LSUFiesta: No. 4 Utah vs. No. 5 Oregon/No. 12 Liberty
Semifinals, January 9-10
Orange: Sugar Bowl winner vs. Fiesta Bowl winnerCotton: Rose Bowl winner vs. Peach Bowl winner
Championship Game, January 20th
Atlanta: Orange Bowl winner vs. Cotton Bowl winner
Return to Main Menu
NFL Week 1 Picks
Betting – Survivor – Pick’em
Start Free TrialGet The Season
FBS Conference Breakdowns
Below, you will find all nine FBS conferences and FBS independents (we are grouping the two remaining Pac-12 teams, Oregon State and Washington State, here).
Each conference table shows the team’s power rating and rank among all FBS teams. The full table for all 134 teams is at the bottom of this article.
It then shows the projected W-L record in regular-season games (no conference championship games included here) for all games, as well as conference-only games.
Finally, it shows our projected odds of winning the conference title, which does account for the chances of playing in and winning the conference title games.
Quick LinksACC | Big Ten | Big 12 | Pac-12 | SECAAC | Conf. USA | MAC | MWC | Sun Belt | Independents
Return to Main Menu
ACC Football Preseason Predictions 2024
| Team | Rating | Rank | Overall W | Overall L | Conf W | Conf L | Win Conf |
| Clemson | 17.4 | 15 | 8.8 | 3.2 | 6.0 | 2.0 | 22.1% |
| Florida St | 17.7 | 12 | 8.8 | 3.2 | 5.9 | 2.1 | 22.5% |
| Miami | 13.3 | 20 | 8.6 | 3.4 | 5.4 | 2.6 | 13.3% |
| NC State | 10.1 | 31 | 8.3 | 3.7 | 5.2 | 2.8 | 7.6% |
| S Methodist | 9.4 | 35 | 8.4 | 3.6 | 5.1 | 2.9 | 7.6% |
| Louisville | 10.6 | 29 | 7.6 | 4.4 | 5.0 | 3.0 | 8.1% |
| VA Tech | 9.0 | 37 | 8.2 | 3.8 | 4.9 | 3.1 | 7.0% |
| N Carolina | 5.0 | 44 | 7.5 | 4.5 | 4.4 | 3.6 | 3.6% |
| Syracuse | 1.1 | 57 | 6.6 | 5.4 | 3.4 | 4.6 | 1.5% |
| California | 2.2 | 55 | 6.1 | 5.9 | 3.4 | 4.6 | 1.4% |
| GA Tech | 4.1 | 47 | 5.3 | 6.7 | 3.2 | 4.8 | 1.9% |
| Boston Col | -0.5 | 64 | 5.2 | 6.8 | 2.9 | 5.1 | 0.8% |
| Pittsburgh | -1.5 | 73 | 5.4 | 6.6 | 2.9 | 5.1 | 0.7% |
| Wake Forest | -2.5 | 78 | 5.1 | 6.9 | 2.8 | 5.2 | 0.6% |
| Virginia | -2.4 | 77 | 4.6 | 7.4 | 2.6 | 5.4 | 0.4% |
| Duke | -1.2 | 70 | 5.4 | 6.6 | 2.4 | 5.6 | 0.6% |
| Stanford | -3.0 | 81 | 4.3 | 7.7 | 2.3 | 5.7 | 0.4% |
Clemson and Florida State are in a virtual tie atop the ACC projections, with similar power ratings, projected conference wins within 0.1 of each other, and conference winning odds less than 1% apart. Florida State hosts Clemson this year in a matchup that could determine regular-season superiority.
SMU, California, and Stanford joined the conference, meaning the ACC will now span the entire country. SMU is projected to finish highest among the newcomers.
Return to Conference Menu
Big 12 Football Preseason Predictions 2024
| Team | Rating | Rank | Overall W | Overall L | Conf W | Conf L | Win Conf |
| Utah | 17.5 | 13 | 9.2 | 2.8 | 7.3 | 2.7 | 24.0% |
| Kansas St | 16.2 | 18 | 8.8 | 3.2 | 7.1 | 2.9 | 19.4% |
| Oklahoma St | 13.8 | 19 | 8.3 | 3.7 | 5.6 | 3.4 | 10.2% |
| Kansas | 11.3 | 24 | 7.9 | 4.1 | 5.4 | 3.6 | 7.7% |
| Iowa St | 12.4 | 21 | 7.6 | 4.4 | 5.2 | 3.8 | 8.2% |
| UCF | 10.3 | 30 | 7.5 | 4.5 | 5.2 | 3.8 | 5.7% |
| Arizona | 10.1 | 32 | 7.5 | 4.5 | 5.5 | 4.5 | 5.7% |
| Texas Tech | 8.4 | 38 | 7.3 | 4.7 | 4.8 | 4.2 | 4.0% |
| W Virginia | 10.7 | 28 | 6.7 | 5.3 | 4.7 | 4.3 | 5.3% |
| TX Christian | 9.3 | 36 | 6.9 | 5.1 | 4.7 | 4.3 | 4.6% |
| Baylor | 3.8 | 51 | 5.5 | 6.5 | 3.8 | 6.2 | 1.6% |
| Colorado | 4.7 | 45 | 5.4 | 6.6 | 3.4 | 5.6 | 1.6% |
| Cincinnati | 1.7 | 56 | 5.4 | 6.6 | 3.3 | 5.7 | 0.7% |
| BYU | 0.5 | 60 | 4.8 | 7.2 | 3.0 | 6.0 | 0.6% |
| Houston | -0.2 | 61 | 4.0 | 8.0 | 2.7 | 6.3 | 0.5% |
| Arizona St | -1.7 | 74 | 4.0 | 8.0 | 2.3 | 6.7 | 0.2% |
Oklahoma and Texas moved on to the SEC, and former Pac-12 members Arizona, Arizona State, Colorado, and Utah are in this year. Utah is the projected favorite entering the season. It is a wide-open conference, though, as ten teams are given at least a 4% chance of winning this year.
Return to Conference Menu
Big Ten Football Preseason Predictions 2024
| Team | Rating | Rank | Overall W | Overall L | Conf W | Conf L | Win Conf |
| Ohio St | 27.7 | 2 | 10.3 | 1.7 | 7.3 | 1.7 | 32.9% |
| Oregon | 23.8 | 4 | 10.0 | 2.0 | 7.2 | 1.8 | 21.2% |
| Penn St | 23.0 | 6 | 9.9 | 2.1 | 7.2 | 1.8 | 20.1% |
| Michigan | 19.4 | 10 | 8.9 | 3.1 | 6.6 | 2.4 | 11.7% |
| Iowa | 12.4 | 23 | 8.0 | 4.0 | 5.6 | 3.4 | 3.6% |
| USC | 12.4 | 22 | 6.8 | 5.2 | 5.1 | 3.9 | 3.6% |
| Nebraska | 9.4 | 34 | 7.5 | 4.5 | 4.9 | 4.1 | 1.7% |
| Wisconsin | 9.7 | 33 | 6.6 | 5.4 | 4.5 | 4.5 | 1.8% |
| Rutgers | 3.6 | 52 | 6.5 | 5.5 | 4.3 | 4.7 | 0.8% |
| Maryland | 4.1 | 46 | 6.4 | 5.6 | 3.9 | 5.1 | 0.4% |
| UCLA | 4.0 | 48 | 5.1 | 6.9 | 3.5 | 5.5 | 0.6% |
| Washington | 5.2 | 43 | 6.0 | 6.0 | 3.5 | 5.5 | 0.4% |
| Minnesota | 2.7 | 54 | 5.5 | 6.5 | 3.1 | 5.9 | 0.3% |
| Indiana | -1.0 | 68 | 5.8 | 6.2 | 3.1 | 5.9 | 0.3% |
| Illinois | 0.6 | 59 | 5.2 | 6.8 | 3.1 | 5.9 | 0.2% |
| Northwestern | -0.8 | 67 | 4.9 | 7.1 | 2.9 | 6.1 | 0.1% |
| Purdue | -0.6 | 66 | 4.2 | 7.8 | 2.7 | 6.3 | 0.1% |
| Michigan St | -1.3 | 71 | 4.9 | 7.1 | 2.7 | 6.3 | 0.1% |
The Big Ten is up to 18 teams, with the two Los Angeles schools plus Oregon and Washington joining from the Pac-12. Michigan has owned the Big Ten in recent years, but Jim Harbaugh is now gone, and Ohio State is the favorite. Oregon and Penn State join Michigan as the other projected contenders.
The Big Ten East and West designations have gone away, which means the top two teams across the entire conference will meet each other in the title game, unlike recent years where the top East teams have dominated and been heavily favored in the title game.
Return to Conference Menu
SEC Football Preseason Predictions 2024
| Team | Rating | Rank | Overall W | Overall L | Conf W | Conf L | Win Conf |
| Georgia | 32.6 | 1 | 10.3 | 1.7 | 6.5 | 1.5 | 36.3% |
| Texas | 24.3 | 3 | 9.5 | 2.5 | 6.0 | 2.0 | 15.2% |
| Alabama | 23.6 | 5 | 9.0 | 3.0 | 5.4 | 2.6 | 10.9% |
| Mississippi | 20.7 | 7 | 9.1 | 2.9 | 5.3 | 2.7 | 8.2% |
| LSU | 19.8 | 9 | 8.7 | 3.3 | 5.2 | 2.8 | 7.7% |
| Missouri | 17.0 | 17 | 9.0 | 3.0 | 5.2 | 2.8 | 5.1% |
| Tennessee | 18.0 | 11 | 8.7 | 3.3 | 5.0 | 3.0 | 4.7% |
| Texas A&M | 17.4 | 16 | 8.4 | 3.6 | 4.9 | 3.1 | 5.4% |
| Oklahoma | 17.5 | 14 | 7.6 | 4.4 | 3.9 | 4.1 | 3.4% |
| Auburn | 11.1 | 26 | 7.2 | 4.8 | 3.5 | 4.5 | 0.9% |
| Kentucky | 10.7 | 27 | 6.7 | 5.3 | 3.3 | 4.7 | 0.8% |
| Florida | 11.2 | 25 | 5.3 | 6.7 | 3.0 | 5.0 | 0.9% |
| S Carolina | 6.2 | 39 | 5.6 | 6.4 | 2.6 | 5.4 | 0.3% |
| Arkansas | 3.8 | 50 | 5.0 | 7.0 | 2.0 | 6.0 | 0.2% |
| Miss State | -0.6 | 65 | 4.3 | 7.7 | 1.4 | 6.6 | 0.0% |
| Vanderbilt | -7.7 | 92 | 3.2 | 8.8 | 0.8 | 7.2 | 0.0% |
With Oklahoma and Texas joining, nine different SEC teams are in our Top 20, and three more are in the Top 30. Georgia is still seen as the class of the conference, but there is plenty of intrigue about which team can emerge to challenge them and reach the title game in the toughest conference in the country.
The weekly battles should also have plenty on the line, as the new playoff format will allow several SEC teams to make the playoffs in 2024.
Return to Conference Menu
AAC Football Preseason Predictions 2024
| Team | Rating | Rank | Overall W | Overall L | Conf W | Conf L | Win Conf |
| Memphis | 5.9 | 40 | 8.6 | 3.4 | 5.7 | 2.3 | 24.0% |
| Tulane | 3.9 | 49 | 7.7 | 4.3 | 5.7 | 2.3 | 22.5% |
| UTSA | 1.0 | 58 | 8.0 | 4.0 | 5.5 | 2.5 | 15.9% |
| S Florida | -0.4 | 62 | 7.0 | 5.0 | 4.9 | 3.1 | 10.9% |
| E Carolina | -7.7 | 93 | 6.4 | 5.6 | 4.5 | 3.5 | 4.6% |
| Rice | -2.8 | 80 | 7.0 | 5.0 | 4.1 | 3.9 | 6.1% |
| Army | -8.5 | 98 | 6.0 | 6.0 | 4.1 | 3.9 | 4.4% |
| North Texas | -8.6 | 99 | 5.6 | 6.4 | 3.7 | 4.3 | 2.5% |
| Fla Atlantic | -11.7 | 110 | 5.9 | 6.1 | 3.6 | 4.4 | 1.9% |
| Navy | -8.8 | 101 | 5.2 | 6.8 | 3.4 | 4.6 | 2.6% |
| UAB | -8.0 | 94 | 6.0 | 6.0 | 3.4 | 4.6 | 2.2% |
| Tulsa | -12.8 | 114 | 5.0 | 7.0 | 3.2 | 4.8 | 1.4% |
| Charlotte | -12.6 | 113 | 4.0 | 8.0 | 2.5 | 5.5 | 1.0% |
| Temple | -22.7 | 131 | 2.4 | 9.6 | 1.6 | 6.4 | 0.0% |
Memphis is the projected favorite, ahead of Tulane. The American Conference winner should be in contention to claim a playoff spot as one of the best five conference champions, so this race could be pretty significant.
Return to Conference Menu
C-USA Football Preseason Predictions 2024
| Team | Rating | Rank | Overall W | Overall L | Conf W | Conf L | Win Conf |
| Liberty | 5.4 | 42 | 10.2 | 1.8 | 7.0 | 1.0 | 60.7% |
| W Kentucky | -5.5 | 86 | 7.2 | 4.8 | 5.4 | 2.6 | 14.7% |
| Jksnville St | -6.3 | 88 | 7.5 | 4.5 | 5.3 | 2.7 | 13.3% |
| Middle Tenn | -14.0 | 115 | 5.2 | 6.8 | 4.0 | 4.0 | 3.6% |
| Sam Hous St | -14.8 | 117 | 4.9 | 7.1 | 3.9 | 4.1 | 2.9% |
| LA Tech | -18.1 | 123 | 4.9 | 7.1 | 3.6 | 4.4 | 1.9% |
| TX El Paso | -19.6 | 124 | 4.2 | 7.8 | 3.3 | 4.7 | 1.1% |
| Florida Intl | -21.1 | 129 | 4.3 | 7.7 | 3.0 | 5.0 | 0.7% |
| N Mex State | -20.0 | 126 | 4.1 | 7.9 | 2.7 | 5.3 | 1.0% |
| Kennesaw St | -25.8 | 134 | 2.8 | 9.2 | 1.9 | 6.1 | 0.0% |
Liberty is the class of Conference USA, and we project them for 10.2 wins. We also give the Flames a 24% chance of a 12-0 regular season (before having to also win the title game). They probably need to run the table to make the playoffs, as the late September game at Appalachian State is the only one against a team ranked inside our preseason Top 80.
Return to Conference Menu
MAC Football Preseason Predictions 2023
| Team | Rating | Rank | Overall W | Overall L | Conf W | Conf L | Win Conf |
| Miami (OH) | -1.2 | 69 | 7.6 | 4.4 | 5.8 | 2.2 | 27.0% |
| Toledo | -3.3 | 82 | 8.1 | 3.9 | 5.4 | 2.6 | 21.4% |
| W Michigan | -8.7 | 100 | 6.5 | 5.5 | 5.0 | 3.0 | 10.5% |
| N Illinois | -6.3 | 89 | 6.6 | 5.4 | 4.7 | 3.3 | 12.1% |
| Bowling Grn | -8.4 | 97 | 6.0 | 6.0 | 4.4 | 3.6 | 9.2% |
| Ohio | -12.0 | 111 | 5.7 | 6.3 | 4.3 | 3.7 | 5.5% |
| Central Mich | -10.2 | 104 | 6.2 | 5.8 | 3.8 | 4.2 | 6.2% |
| Buffalo | -17.2 | 121 | 5.2 | 6.8 | 3.4 | 4.6 | 2.1% |
| Ball St | -15.1 | 119 | 4.6 | 7.4 | 3.2 | 4.8 | 2.9% |
| E Michigan | -17.3 | 122 | 4.7 | 7.3 | 3.1 | 4.9 | 1.9% |
| Akron | -20.8 | 128 | 3.3 | 8.7 | 2.5 | 5.5 | 0.9% |
| Kent St | -22.9 | 132 | 3.1 | 8.9 | 2.3 | 5.7 | 0.5% |
Miami (Ohio) beat Toledo in the MAC Title Game a year ago, and those two are the preseason favorites to win the conference this year.
Return to Conference Menu
Mountain West Football Preseason Predictions 2023
| Team | Rating | Rank | Overall W | Overall L | Conf W | Conf L | Win Conf |
| Boise St | 5.6 | 41 | 8.9 | 3.1 | 5.7 | 1.3 | 37.6% |
| Fresno St | -2.3 | 76 | 7.6 | 4.4 | 4.9 | 2.1 | 15.3% |
| UNLV | -2.6 | 79 | 6.9 | 5.1 | 4.5 | 2.5 | 13.9% |
| Air Force | -5.9 | 87 | 7.1 | 4.9 | 4.4 | 2.6 | 9.2% |
| Wyoming | -6.9 | 91 | 6.4 | 5.6 | 3.9 | 3.1 | 7.7% |
| Colorado St | -9.0 | 102 | 6.1 | 5.9 | 3.9 | 3.1 | 5.2% |
| Hawaii | -11.4 | 108 | 5.8 | 6.2 | 3.2 | 3.8 | 2.8% |
| San Diego St | -10.5 | 106 | 5.2 | 6.8 | 3.1 | 3.9 | 2.7% |
| Utah St | -11.3 | 107 | 5.0 | 7.0 | 3.1 | 3.9 | 2.7% |
| San Jose St | -12.1 | 112 | 5.0 | 7.0 | 2.6 | 4.4 | 2.4% |
| Nevada | -20.5 | 127 | 2.8 | 10.2 | 1.4 | 5.6 | 0.3% |
| New Mexico | -22.4 | 130 | 2.6 | 9.4 | 1.4 | 5.6 | 0.2% |
Boise State is back as the favorite to win the Mountain West, while the team they beat in the title game, UNLV, was a surprise and is projected to finish third this year. Fresno State is the other most likely contender.
Return to Conference Menu
Sun Belt Football Preseason Predictions 2023
| East | Rating | Rank | Overall W | Overall L | Conf W | Conf L | Win Conf |
| App State | 2.9 | 53 | 8.2 | 3.8 | 5.9 | 2.1 | 27.1% |
| James Mad | -4.6 | 85 | 7.7 | 4.3 | 5.1 | 2.9 | 9.9% |
| Marshall | -10.2 | 105 | 5.5 | 6.5 | 4.0 | 4.0 | 3.4% |
| Coastal Car | -8.3 | 96 | 6.2 | 5.8 | 3.8 | 4.2 | 4.8% |
| GA Southern | -10.1 | 103 | 5.3 | 6.7 | 3.5 | 4.5 | 3.1% |
| Old Dominion | -11.4 | 109 | 4.3 | 7.7 | 3.2 | 4.8 | 2.5% |
| Georgia St | -14.5 | 116 | 4.5 | 7.5 | 2.7 | 5.3 | 1.0% |
| West | Rating | Rank | Overall W | Overall L | Conf W | Conf L | Win Conf |
| Texas St | -3.3 | 83 | 7.9 | 4.1 | 5.2 | 2.8 | 13.0% |
| Louisiana | -1.9 | 75 | 7.8 | 4.2 | 5.1 | 2.9 | 13.7% |
| S Alabama | -4.1 | 84 | 6.9 | 5.1 | 4.6 | 3.4 | 9.3% |
| Troy | -6.7 | 90 | 6.4 | 5.6 | 4.4 | 3.6 | 6.0% |
| Arkansas St | -8.3 | 95 | 5.9 | 6.1 | 4.3 | 3.7 | 5.0% |
| S Mississippi | -14.8 | 118 | 4.2 | 7.8 | 2.8 | 5.2 | 1.2% |
| UL Monroe | -23.4 | 133 | 2.2 | 9.8 | 1.4 | 6.6 | 0.1% |
James Madison was the class of the Sun Belt a year ago, finishing the regular season ranked, but could not play in the conference title game after transitioning from FCS. However, Coach Curt Cignetti has left for Indiana, and JMU is only projected with the fourth-highest odds to win the conference this year.
Appalachian State had several close losses last year but is projected to bounce back and be the favorite to win the Sun Belt in 2024.
Return to Conference Menu
Independent FBS and Pac-12 Football Preseason Predictions 2024
| Team | Rating | Rank | Overall W | Overall L |
| Notre Dame | 20.3 | 8 | 9.8 | 2.2 |
| Oregon St | -0.5 | 63 | 7.1 | 4.9 |
| Wash State | -1.3 | 72 | 7.3 | 4.7 |
| Connecticut | -16.7 | 120 | 4.6 | 7.4 |
| U Mass | -19.7 | 125 | 3.4 | 8.6 |
Oregon State and Washington State are officially Independents for this season after being the two teams left out of the Pac-12 musical chairs last year. However, they do have an agreement with the Mountain West, where each will play an additional six games against MWC opponents this year (beyond any non-conference games they had already set) to make up for the loss of the scheduled conference matchups.
Notre Dame, meanwhile, is again the class of the Independent ranks and is inside our Top 10. The new playoff format is good news/bad news for Notre Dame: they cannot be a top-four seed no matter how well they play because that will go to conference champs, but they now have a wider margin of error to qualify for the playoffs. Going 10-2 or better should put them in playoff contention, and our projections give them about a 64% chance of finishing with 10 or more wins in 2024.
Return to Conference Menu
2024 Preseason Rankings (All Teams)
Here are our power ratings and rankings for all 134 FBS teams for the 2024 season.
| RANK | TEAM | RATING | LAST YEAR | PROGRAM | RETURN | LUCK | MARKET |
|---|---|---|---|---|---|---|---|
| 1 | Georgia | 32.6 | 20.4 | 6.1 | 0.6 | 0.7 | 4.8 |
| 2 | Ohio State | 27.7 | 17.7 | 6.0 | -0.8 | -0.6 | 5.4 |
| 3 | Texas | 24.3 | 16.8 | 3.5 | -2.8 | -1.3 | 8.1 |
| 4 | Oregon | 23.8 | 20.3 | 2.1 | -2.1 | -1.6 | 5.1 |
| 5 | Alabama | 23.6 | 16.6 | 7.3 | -1.9 | -0.7 | 2.2 |
| 6 | Penn State | 23.0 | 17.7 | 2.7 | 4.2 | -0.1 | -1.4 |
| 7 | Mississippi | 20.7 | 12.3 | 2.5 | 0.9 | -1.0 | 6.0 |
| 8 | Notre Dame | 20.3 | 17.5 | 4.1 | -0.3 | -2.1 | 1.0 |
| 9 | Louisiana State | 19.8 | 15.7 | 1.8 | -4.0 | 0.6 | 5.7 |
| 10 | Michigan | 19.4 | 21.5 | 2.9 | -1.9 | -1.6 | -1.4 |
| 11 | Tennessee | 18.0 | 11.1 | 2.0 | -1.4 | 0.5 | 5.7 |
| 12 | Florida State | 17.7 | 13.2 | 0.0 | -3.8 | -0.6 | 9.0 |
| 13 | Utah | 17.5 | 5.8 | 2.5 | 1.0 | -0.3 | 8.5 |
| 14 | Oklahoma | 17.5 | 15.9 | 4.4 | -0.8 | -1.4 | -0.6 |
| 15 | Clemson | 17.4 | 8.6 | 4.7 | 5.1 | -0.8 | -0.2 |
| 16 | Texas A&M | 17.4 | 10.3 | 3.4 | -1.0 | 0.2 | 4.5 |
| 17 | Missouri | 17.0 | 13.3 | 0.4 | 5.0 | -2.1 | 0.5 |
| 18 | Kansas State | 16.2 | 14.5 | 1.5 | 0.0 | -1.0 | 1.2 |
| 19 | Oklahoma State | 13.8 | 4.1 | 3.3 | 6.6 | 0.2 | -0.3 |
| 20 | Miami | 13.3 | 6.9 | 2.0 | -2.8 | 1.4 | 5.8 |
| 21 | Iowa State | 12.4 | 5.7 | 3.6 | 8.5 | -1.8 | -3.6 |
| 22 | Southern California | 12.4 | 8.7 | 1.7 | -6.7 | 0.8 | 7.8 |
| 23 | Iowa | 12.4 | 2.8 | 3.4 | 5.8 | 0.0 | 0.3 |
| 24 | Kansas | 11.3 | 7.4 | -3.1 | 2.9 | 1.4 | 2.7 |
| 25 | Florida | 11.2 | 4.9 | 2.9 | 4.5 | 0.9 | -2.0 |
| 26 | Auburn | 11.1 | 5.4 | 2.4 | 1.9 | -0.2 | 1.5 |
| 27 | Kentucky | 10.7 | 5.0 | 1.6 | 2.0 | 1.1 | 1.1 |
| 28 | West Virginia | 10.7 | 5.2 | 1.4 | 3.5 | -0.3 | 0.9 |
| 29 | Louisville | 10.6 | 8.6 | 1.5 | -6.3 | -1.4 | 8.2 |
| 30 | Central Florida | 10.3 | 4.3 | 1.6 | -0.8 | 0.0 | 5.3 |
| 31 | NC State | 10.1 | 5.5 | 1.7 | -0.4 | -1.1 | 4.3 |
| 32 | Arizona | 10.1 | 10.9 | -2.5 | -3.2 | -1.4 | 6.3 |
| 33 | Wisconsin | 9.7 | 3.8 | 3.3 | 1.4 | -0.1 | 1.4 |
| 34 | Nebraska | 9.4 | 0.4 | 1.3 | 3.5 | 2.5 | 1.7 |
| 35 | Southern Methodist | 9.4 | 9.8 | 0.8 | 5.8 | -0.9 | -6.3 |
| 36 | Texas Christian | 9.3 | 5.6 | 1.7 | 0.4 | 0.2 | 1.4 |
| 37 | Virginia Tech | 9.0 | 4.2 | 0.5 | 7.4 | 0.3 | -3.3 |
| 38 | Texas Tech | 8.4 | 4.3 | 0.4 | 1.2 | 0.2 | 2.3 |
| 39 | South Carolina | 6.2 | 3.9 | 0.1 | -3.0 | -0.5 | 5.7 |
| 40 | Memphis | 5.9 | 3.5 | -0.2 | 2.3 | -0.4 | 0.8 |
| 41 | Boise State | 5.6 | 2.6 | 1.2 | 3.0 | -0.1 | -1.0 |
| 42 | Liberty | 5.4 | 3.3 | 0.6 | 2.7 | -1.3 | 0.2 |
| 43 | Washington | 5.2 | 13.6 | 0.6 | -13.5 | 0.2 | 4.3 |
| 44 | North Carolina | 5.0 | 5.1 | 2.1 | 0.7 | -0.9 | -2.1 |
| 45 | Colorado | 4.7 | -0.9 | -0.7 | -2.3 | -3.1 | 11.7 |
| 46 | Maryland | 4.1 | 6.6 | 0.6 | -0.2 | -0.4 | -2.6 |
| 47 | Georgia Tech | 4.1 | 3.2 | -1.2 | 4.1 | -0.3 | -1.7 |
| 48 | UCLA | 4.0 | 5.2 | 2.1 | -0.5 | 0.0 | -2.8 |
| 49 | Tulane | 3.9 | 1.2 | 0.5 | -2.2 | 1.0 | 3.4 |
| 50 | Arkansas | 3.8 | 0.4 | 1.9 | 1.1 | 1.1 | -0.7 |
| 51 | Baylor | 3.8 | -5.0 | 1.9 | 4.7 | -0.3 | 2.4 |
| 52 | Rutgers | 3.6 | 4.0 | -0.2 | 3.2 | -1.8 | -1.7 |
| 53 | Appalachian State | 2.9 | -0.3 | 1.2 | 6.1 | -0.3 | -3.8 |
| 54 | Minnesota | 2.7 | -2.2 | 1.7 | 2.9 | 1.2 | -0.9 |
| 55 | California | 2.2 | 1.7 | 0.0 | 0.7 | 1.1 | -1.3 |
| 56 | Cincinnati | 1.7 | -3.6 | 3.7 | -3.2 | 0.9 | 3.9 |
| 57 | Syracuse | 1.1 | -3.2 | -0.6 | 0.4 | -0.6 | 5.1 |
| 58 | Texas-San Antonio | 1.0 | 1.5 | -0.3 | 0.1 | 0.6 | -0.8 |
| 59 | Illinois | 0.6 | -1.3 | 0.1 | -0.8 | 0.2 | 2.3 |
| 60 | Brigham Young | 0.5 | -1.9 | 3.1 | 3.3 | -0.1 | -3.7 |
| 61 | Houston | -0.2 | -2.9 | 0.9 | -0.9 | 0.0 | 2.8 |
| 62 | South Florida | -0.4 | -4.9 | -2.6 | 6.1 | 0.4 | 0.6 |
| 63 | Oregon State | -0.5 | 9.0 | 0.9 | -8.3 | -0.1 | -2.0 |
| 64 | Boston College | -0.5 | -2.9 | 0.1 | 6.9 | 1.5 | -6.1 |
| 65 | Mississippi State | -0.6 | -0.5 | 1.4 | -3.3 | 0.7 | 1.1 |
| 66 | Purdue | -0.6 | -1.3 | 1.5 | 0.3 | 0.4 | -1.4 |
| 67 | Northwestern | -0.8 | 1.0 | 1.0 | 2.6 | -2.8 | -2.6 |
| 68 | Indiana | -1.0 | -2.8 | 1.3 | -1.3 | 1.5 | 0.3 |
| 69 | Miami (Ohio) | -1.2 | -0.8 | -1.0 | 2.4 | -1.6 | -0.2 |
| 70 | Duke | -1.2 | 7.2 | -2.2 | 2.2 | -0.8 | -7.6 |
| 71 | Michigan State | -1.3 | -5.0 | 0.7 | -0.9 | 0.3 | 3.7 |
| 72 | Washington State | -1.3 | 3.9 | 0.2 | -5.6 | 1.1 | -1.0 |
| 73 | Pittsburgh | -1.5 | -3.1 | 2.2 | 0.2 | -0.5 | -0.3 |
| 74 | Arizona State | -1.7 | -6.1 | 2.6 | -1.1 | 1.6 | 1.3 |
| 75 | UL Lafayette | -1.9 | -4.0 | 1.2 | 4.2 | -0.6 | -2.7 |
| 76 | Fresno State | -2.3 | -1.8 | -0.5 | 3.0 | -0.1 | -2.9 |
| 77 | Virginia | -2.4 | -4.3 | 0.8 | 2.5 | 1.4 | -2.8 |
| 78 | Wake Forest | -2.5 | -3.1 | 2.2 | -0.2 | -0.2 | -1.3 |
| 79 | UNLV | -2.6 | 0.0 | -4.0 | 0.1 | -0.9 | 2.2 |
| 80 | Rice | -2.8 | -3.5 | -2.3 | 4.4 | 2.0 | -3.5 |
| 81 | Stanford | -3.0 | -7.5 | -0.2 | 6.7 | 0.1 | -2.0 |
| 82 | Toledo | -3.3 | 0.4 | -0.1 | 2.2 | 0.4 | -6.1 |
| 83 | Texas State | -3.3 | -3.4 | -3.0 | -0.2 | 0.5 | 2.8 |
| 84 | South Alabama | -4.1 | 2.8 | -2.1 | -3.0 | -0.5 | -1.3 |
| 85 | James Madison | -4.6 | 5.7 | 0.3 | -11.7 | -0.8 | 1.8 |
| 86 | Western Kentucky | -5.5 | -4.0 | -0.5 | -2.1 | -0.3 | 1.3 |
| 87 | Air Force | -5.9 | 1.1 | 0.9 | -0.5 | 1.0 | -8.4 |
| 88 | Jacksonville State | -6.3 | -1.0 | -3.2 | -1.7 | -0.5 | 0.2 |
| 89 | Northern Illinois | -6.3 | -6.0 | -2.6 | 4.5 | 0.1 | -2.3 |
| 90 | Troy | -6.7 | 5.5 | -1.3 | -7.4 | -0.9 | -2.6 |
| 91 | Wyoming | -6.9 | -1.6 | -1.0 | 1.5 | -1.6 | -4.2 |
| 92 | Vanderbilt | -7.7 | -6.1 | -3.0 | 0.0 | 1.0 | 0.5 |
| 93 | East Carolina | -7.7 | -6.2 | -0.3 | 1.9 | -0.6 | -2.5 |
| 94 | UAB | -8.0 | -8.2 | 0.3 | 0.9 | 0.1 | -1.2 |
| 95 | Arkansas St. | -8.3 | -6.7 | -2.8 | 3.8 | -0.1 | -2.5 |
| 96 | Coastal Carolina | -8.3 | -1.8 | 1.5 | -3.3 | -0.7 | -4.0 |
| 97 | Bowling Green | -8.4 | -3.1 | -6.1 | 1.5 | -0.9 | 0.1 |
| 98 | Army | -8.5 | -5.6 | 0.4 | 1.6 | 0.8 | -5.6 |
| 99 | North Texas | -8.6 | -6.9 | -2.9 | -6.5 | 0.8 | 6.9 |
| 100 | Western Michigan | -8.7 | -10.8 | -0.7 | 4.8 | -0.4 | -1.5 |
| 101 | Navy | -8.8 | -7.6 | -1.7 | 4.4 | -1.0 | -3.0 |
| 102 | Colorado State | -9.0 | -8.0 | -2.7 | 1.4 | 1.6 | -1.4 |
| 103 | Georgia Southern | -10.1 | -5.7 | -1.7 | -0.6 | 1.0 | -3.1 |
| 104 | Central Michigan | -10.2 | -11.0 | -0.9 | 3.3 | 1.6 | -3.3 |
| 105 | Marshall | -10.2 | -6.7 | 0.6 | -4.7 | -0.3 | 0.9 |
| 106 | San Diego State | -10.5 | -8.9 | 0.0 | -0.8 | 0.4 | -1.3 |
| 107 | Utah State | -11.3 | -6.6 | -2.8 | -1.2 | 0.9 | -1.7 |
| 108 | Hawaii | -11.4 | -12.4 | -2.0 | 9.7 | 1.9 | -8.6 |
| 109 | Old Dominion | -11.4 | -5.8 | -2.2 | 0.8 | -1.1 | -3.1 |
| 110 | Florida Atlantic | -11.7 | -5.6 | -1.8 | -7.2 | -0.1 | 3.0 |
| 111 | Ohio | -12.0 | -2.4 | -2.1 | -7.4 | -2.0 | 1.8 |
| 112 | San Jose State | -12.1 | 0.9 | -0.8 | -4.5 | 0.4 | -8.2 |
| 113 | Charlotte | -12.6 | -11.1 | -3.5 | 2.0 | 1.1 | -1.2 |
| 114 | Tulsa | -12.8 | -10.3 | 0.8 | 0.2 | 0.4 | -3.9 |
| 115 | Middle Tennessee | -14.0 | -7.3 | -2.7 | -1.0 | 1.1 | -4.0 |
| 116 | Georgia St. | -14.5 | -5.5 | -0.8 | -2.0 | -0.4 | -5.8 |
| 117 | Sam Houston State | -14.8 | -10.1 | -4.5 | 3.4 | -0.4 | -3.2 |
| 118 | Southern Miss | -14.8 | -11.8 | -3.5 | -1.3 | 0.4 | 1.4 |
| 119 | Ball State | -15.1 | -10.0 | -0.6 | 0.1 | 1.5 | -6.1 |
| 120 | Connecticut | -16.7 | -11.6 | -4.9 | -1.1 | -1.2 | 2.1 |
| 121 | Buffalo | -17.2 | -11.0 | -0.2 | -3.8 | 0.5 | -2.8 |
| 122 | Eastern Michigan | -17.3 | -13.5 | -1.8 | -3.8 | -0.7 | 2.5 |
| 123 | Louisiana Tech | -18.1 | -11.1 | -2.9 | -3.4 | 2.3 | -3.0 |
| 124 | Texas El Paso | -19.6 | -11.3 | -3.5 | -3.8 | 1.7 | -2.7 |
| 125 | Massachusetts | -19.7 | -14.3 | -7.2 | -2.1 | 0.2 | 3.6 |
| 126 | New Mexico State | -20.0 | -4.0 | -4.4 | -8.8 | -0.7 | -2.1 |
| 127 | Nevada | -20.5 | -15.6 | -0.4 | -0.1 | 0.5 | -5.0 |
| 128 | Akron | -20.8 | -15.9 | -5.9 | -4.3 | 1.0 | 4.3 |
| 129 | Florida International | -21.1 | -15.0 | -5.3 | 2.6 | 1.5 | -5.0 |
| 130 | New Mexico | -22.4 | -11.4 | -3.6 | -1.6 | 2.1 | -7.9 |
| 131 | Temple | -22.7 | -14.8 | -4.1 | -6.4 | 0.2 | 2.5 |
| 132 | Kent State | -22.9 | -20.5 | -1.5 | -0.5 | 0.2 | -0.5 |
| 133 | UL Monroe | -23.4 | -14.6 | -4.9 | -4.8 | -0.2 | 1.1 |
| 134 | Kennesaw St. | -25.8 | n/a | n/a | n/a | n/a | -25.8 |
Return to Main Menu
NFL Week 1 Picks
Betting – Survivor – Pick’em
Start Free TrialGet The Season
How We Make College Football Preseason Predictions
We have identified a set of team-level metrics that have demonstrated predictive value for projecting a team’s upcoming season results.
We identified these metrics by reviewing a decade’s worth of college football data and applying significance tests to any interesting-looking findings. Next, we built an algorithmic model that inputs these metrics and computes a numerical preseason predictive rating for every FBS team.
Please read our deep dive into our college football preseason ratings methodology to learn more about our preseason ratings.
Going from Preseason Ratings to Season Projections
A team’s preseason rating signifies how good we think it will be this upcoming season. Figuring out how many games we expect that team to win is more complicated.
To do that, we run thousands of game-by-game computer simulations of the season, using our predictive ratings to calculate implied win odds for each game.
Thanks to randomness, each season simulation plays out differently. Occasionally, an unheralded team gets lucky in a simulation, makes a run, and wins its conference.
Trends in the results begin to emerge over thousands of simulation runs. The predictions in this post represent the averages of the simulations we conducted.
Why Does Our Approach Make Sense?
Despite some limitations, our simulation-driven approach to preseason college football predictions has proved to be far more accurate than many alternatives.
Some college football experts do a decent job of projecting the future performance level of a team, especially one they’ve studied closely. However, on the whole, humans often have a poor grasp of the potential impact of probability and randomness over a full college football season. For instance, even skilled “college football people” tend to underestimate a great team’s odds of losing to a mediocre or bad team.
A team like Alabama is unlikely to lose to a team like Mississippi State, yet no game is a lock. Throughout a season, even small loss probabilities can add up to a decent chance of a great team losing at least one game to a significantly inferior opponent.
You can’t discount those probabilities, especially when a single win can decide conference championships. Our simulation-driven approach makes sure we never do.
Is it a perfect system? No. When the dust settles at the end of the season, some of our preseason projections will be wrong. Some teams will defy our expectations. Injuries, suspensions, and other unexpected events will derail our forecasts for others.
However, our goal is the system’s overall accuracy—how well it projects the final outcome of all 134 teams this season.
How To Interpret Our CFB Preseason Predictions
In closing, it’s important to understand how our system generates the results it does and what the numbers mean. Here are some key details:
We project a lot of fractional wins. Of course, that can’t be the result in the actual results of a football game. However, we don’t want to reduce precision in the numbers to make them look pretty. For example, a projected 8.4-win team has better prospects than a projected 7.6-win team. If we rounded those numbers, they’d look the same (eight wins each).Even if we project a team with X wins, it doesn’t mean we’re confident it will end up with that exact number. Let’s say we have a team projected to win exactly 7.0 games. Seven wins might have been the most common outcome in our season simulations, but that team may have ended up with six or eight wins nearly as often and hit five or nine wins occasionally. Since our final projection is an average of those outcomes, it ends up at seven wins, but the odds of the team ending up with exactly seven wins aren’t that high.Projections can change slightly day-to-day, even with no new game results. We re-simulate the college football season every day. Randomness in simulation results may cause slight fluctuations in team projections even if no new games have been played. You shouldn’t read too much into tiny differences in the projections. For example, a 0.1% difference in conference champion odds between two teams is practically meaningless.
Return to Main Menu—
If you’re in a college football pool or planning on betting some games this season, check out our Football Pick’em Picks and College Football Betting Picks.
NFL PredictionsNFL TrendsNFL OddsNFL MatchupsNBA PredictionsNBA TrendsNBA OddsNBA MatchupsMLB PredictionsMLB TrendsMLB OddsMLB MatchupsNCAAF PredictionsNCAAF TrendsNCF OddsNCAAF MatchupsNCAAB PredictionsNCAAB TrendsNCB OddsNCAAB Matchups A product ofTeamRankings BlogAboutTeamJobsContact
© 2005-2024 Team Rankings, LLC. All Rights Reserved. Statistical data provided by Gracenote.
TeamRankings.com is not affiliated with the National Collegiate Athletic Association (NCAA®) or March Madness Athletic Association, neither of which has supplied, reviewed, approved or endorsed the material on this site. TeamRankings.com is solely responsible for this site but makes no guarantee about the accuracy or completeness of the information herein.
Terms of ServicePrivacy Policy